In this article we will be focusing on Agile Scrum project management analysis utilizing analytics. In particular, we will examine anonymous beginning-of-the-sprint data from a team that was struggling to improve its Agile processes while dealing with the burden of technical debt and support issues. We will analyze and try to understand what the data is telling us, and make a series of recommendations and improvements for corrective actions.
The technical tools we’ll use to do this will be Python, Pandas, Matplotlib, with source data being extracted from JIRA.
You can view the second part of this write up for a full breakdown of the technical steps we took to extract, clean, and present the data.
The the report discussed in this article can be found here.
Introduction
Much of my work has been in technical leadership for small and medium-sized companies. These are always interesting places to work because there are many opportunities to roll your sleeves up, jump in, and make a difference. One area I find a common need in these settings is to help the organization create effective processes, procedures, and systems. Three areas, in particular, are usually the focus on my efforts:
- Project management
- Quality management
- Release management
These three areas seem to be where most smaller/medium size companies struggle, and it is very rewarding to begin the process of improvement and watch it bear fruit. For example, at a previous company, I took my team—who had historically missed almost every sprint commitment they’d made–to meeting their sprint commitments on time every time. The boost to their morale and standing within the company at large was hugely gratifying.
Why Analytics?
“If you can’t measure it, you can’t improve it.” (Peter Drucker)
I often find when bringing changes about it is often best to start with analytics. Many companies have a back history you may or may not be aware of, or maybe they aren’t sure why their current operations aren’t as effective as they’d like.
By using data, we can neatly sidestep politics, finger-pointing, reopening old wounds, and other sorts of gotchas by focusing on facts and objective measurements. We aren’t worried about who did what in the past; we just want to move the conversation into what we can do in the future as a team to improve our organization.
It is very hard to argue with data, and when people see the objective numbers in black and white it serves to direct the conversation into productive areas focused on solutions.
The Analysis
What that said, let’s get into the analysis. You can find the complete report here.
Assumptions
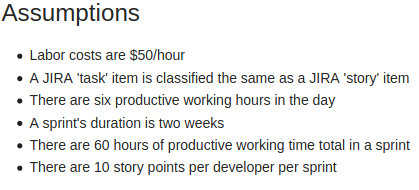
Here, we want to define all the assumptions that will be utilized throughout the analysis. We don’t want to confuse the reader, and we want to be clear about what we’re basing our calculations on in the summary report.
For example, while there may be eight working hours in the day, it seems unreasonable to expect people are working every minute of those eight hours. Time will be spent on meetings, breaks, and other tasks.
Additionally, oftentimes non-technical business members won’t understand the cost of context switching which also reduces productive hours in the day. I find this article is a good way to introduce the concept and start the conversation.
Another concern is clearly defining our assumptions on the general cost of labor. This might be higher or lower than what other business members might have assumed, so calling this out right up front clarifies which unit of measurement will be utilized in cost calculations and facilitates a common understanding.
Budget Analysis
Beginning of Sprint Budget Summary
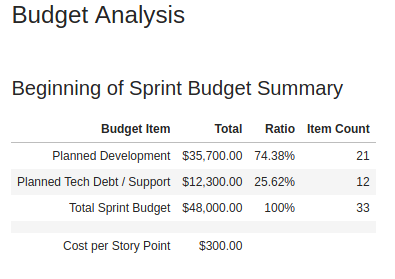
For this department, I’ve broken the sprint’s “budget” into two main categories: Development expenses which (hopefully) generate business value, and expenses assigned to dealing with technical debt and support.
I have counted the total amount of funds spent on the sprint based on assumed labor costs, computed the ratios against the whole, and also described the cost per story point based on the team’s forecasted velocity for the sprint.
We could be much more granular with the expenditures towards business value. However; in this situation, I was dealing with a department saddled with technical debt and support issues. My first goal was to keep things simple at first to highlight the non-value generating costs that were occurring and help members of the business understand how much potential customer value was being drained away by fixes and code cleanups.
Once that shift in perspective was accomplished it would make sense to then bin the value-adding activities in a more partitioned way for deeper ROI analysis.
Story Point Analysis
Sprint User Story and Point Summary
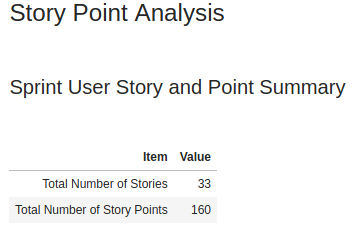
We’ll start this section off with a tabular element providing a quick overview of the number of stories as well as the total story points allocated in the sprint-based team’s velocity and availability.
Distribution of User Stories and User Story Points by Type
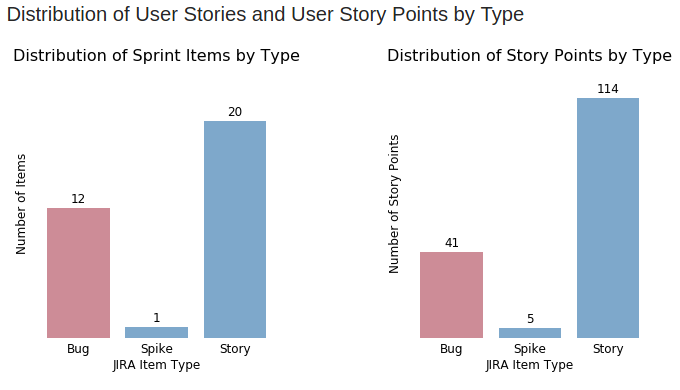
The next two graphs deal with the distributions of user stories and their assigned points. In particular, we want to examine the number of user stories and story points grouped by type for the sprint.
We can see that 50% of the user stories and 35% of the velocity in this sprint are allocated to non-value generating activities (i.e. technical debt and support items).
The visuals in these graphs create an entry point into productive conversations with members of the business to help them understand the impact of technical debt and support: Imagine how much more customer value we could give the business if we could double the number of productive user stories we work on and increase our ability to deliver roadmap items by 35%!
I have yet to meet a sales or marketing team member not become excited by this idea, and it paves the way into collaborative discussions on how to remove technical roadblocks. Something that simply seemed like an engineering team issue can now be linked to business goals and objectives by non-technical folks.
Distribution of User Story Points by Size
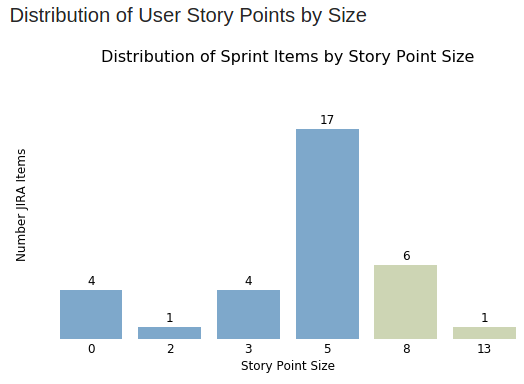
This graph depicts the number of user stories accepted into the sprint grouped by story point size, and it allows the scrum master and team to quickly identify and address outliers and problematic items.
So for example, we can see that we have a thirteen point ticket (with ten being the maximum story point size allowed for this sprint), an eight-point ticket, and four zero-point tickets.
The thirteen- and eight-point tickets are problematic because we assume that ten points are the team’s average velocity per sprint per developer. Having a thirteen- and eight-point ticket means that these won’t be finished until the very last moment of the sprint (if at all).
Additionally, with tickets like these, how do we track their daily progress? How do we know if they are blocked or need help?
Often, blockers and other issues that will prevent story completion don’t reveal themselves till near the end of the work, and then there won’t be any time left in the sprint for the scrum master and product owner to mitigate and remove obstacles.
With a smaller ticket we can raise a red flag early on if we don’t see board movement after a few days, but that won’t be the case with these two items.
These tickets need to be decomposed into smaller sized stories/tasks that allow for 1) iterable, trackable development, and 2) greater transparency into progress, so the team can act in time if blockers or other impediments surface.
Lastly, we have four zero-point user stories. These may or may not be an issue: Perhaps they are items so small that they can be completed in a matter of minutes and are included for bookkeeping. Or perhaps they are indicators of a larger issue occurring during sprint refinement and/or planning.
I would recommend that the scrum master inspect each of these items and validate the story point values assigned. If it turns out these stories should have had a non-zero value assigned then this would be a good coaching area for how to properly refine and estimate stories and what to include during sprint planning.
Other than that, the graph looks good, and the team is decomposing the majority of their stories into smaller items.
Least and Greatest Story Point Items
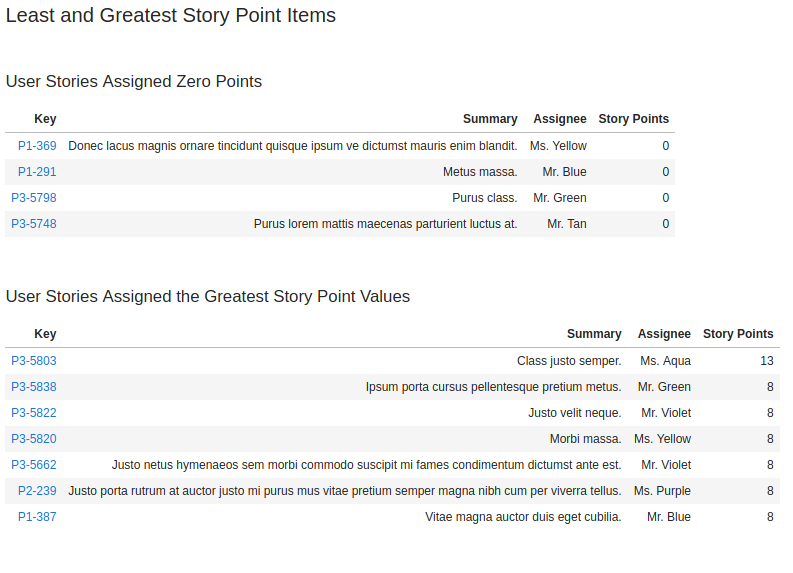
Next, we have two table elements in the report that provide details and links to the specific JIRA items in the sprint that have either been 1) assigned zero story points, or 2) have been assigned the largest number of story points.
This should enable the team to quickly have access to these items for investigation and remedial actions if required as recommended above.
User Story Rollover Distribution
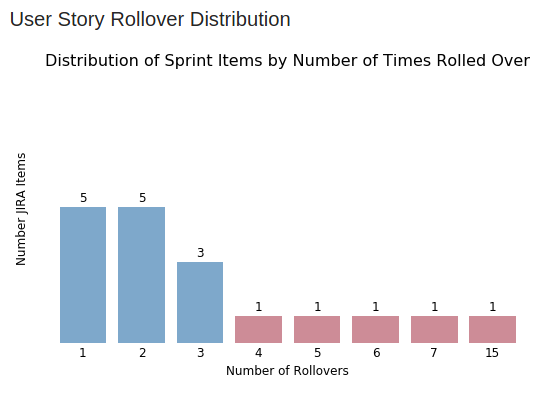
This is probably my favorite graph, as it drives conversation around what is important to the business.
This report element depicts the number of times one or more JIRA items have rolled over from one sprint to the next. We can see for example that we have five items that have rolled over sprint-to-sprint four or more times. We even have an outlier that has rolled over fifteen sprints in a row!
The question this graph poses is the following: If something has rolled over sprint-to-sprint fifteen times, is it really of any value to the business? Should we be wasting our time thinking about this story when we haven’t needed it completed for over half a year?
The answer is obviously ”no”, or resources would have been allocated to the story and it would have been finished by now. At this moment; however, it is simply clogging up the sprint, and causing us to spend thought power on it vs. focusing 100% on the actual items delivering business value.
Remember: A key concept of Agile Scrum is just-in-time flexible delivery of what’s most important to the business. This is why, for example, we don’t groom the backlog one year in advance, and most product owners will groom only two to three sprints out. Further planning beyond this may very well be wasted effort, because the business may need to pivot and do something different in the meantime. We want to stay flexible and only expend effort on the things that count deliver value.
Simplicity–the art of maximizing the amount of work not done–is essential.
My recommendation would be for the product owner and scrum master to examine the items that have rolled over sprint-to-sprint and consider 1) removing them from the backlog altogether, 2) inserting them into a much lower spot in the backlog to reflect their true priority, or 3) identify if this is a red flag indicating perhaps a deeper issue is at play in the sprint planning processes and/or iteration execution that needs to be addressed.
Most Rolled Over User Stories

Again, we include a tabular data element with direct links to the rollover items the team would want or need to investigate based on the recommendations we made above.
User Story Point Statistics

The last two items in this report are the descriptive statistics of the user story points assigned to the work items in this sprint.
In particular, I would recommend the team focusing on the following elements:
- Std
- Min
- Max
Note that std is an abbreviation for standard deviation.
In statistics, the standard deviation is a measure of the amount of variation or dispersion of a set of values. A low standard deviation indicates that the values tend to be close to the mean (also called the expected value) of the set, while a high standard deviation indicates that the values are spread out over a wider range. Source
So in our case, our goal would be to reduce the std value over time as we become more skilled at decomposing user stories into smaller, more equal parts. This in turn allows us to identify blockers much sooner since smaller stories will have much more board movement. If a story sits in the same status for more than a few days, the scrum master can assist with facilitation, coaching, and/or help to remove blockers. The result will be a more consistent, repeatable delivery of forecasted sprint items as planned. This directly impacts other business unit activities such as marketing who need to prepare their materials in sync with upcoming, new features and functionality.
Min and Max we covered earlier in the Story Point Analysis section above. However, to recap:
- We want to avoid large stories, because tracking their progress and/or identifying and removing blockers early on is difficult when they sit in the same board status for most of the sprint.
- We want to validate that story points with a zero size have been correctly pointed and these aren’t a sign of some underlying issue the scrum master should address and/or provide coaching on.
Wrapping Up
In this article we provided analytical analysis, commentary and suggestions for a team working to improve their Agile Sprint processes based on source data extracted from JIRA for the beginning of their sprint.
Our next goal will be to pull similar data at the end of the sprint and provide insights and guidance regarding what was accomplished during the sprint vs. what was planned at the start. We’ll also want to perform time series and regression analysis once we have multiple sprints completed to gauge progress over time and identify trends (both positive and negative).
You can view the second part of this write up here for a full breakdown of the technical steps we took to extract, clean, and present the data if you’d like to try this yourself for your organization and/or project.
You can also find the complete report discussed in this article here.


Comments